Page author: @vtemplier @cmoineau
VSCode debugger for Python/C++ code
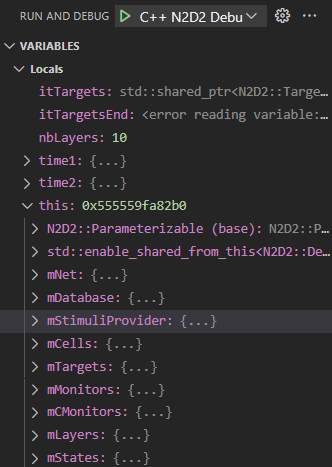
Instead of wasting your time looking at some variables, why not look at them all at once without having to write an extra line of code?
For that, continue to follow this tutorial to learn how to use a debugger.
Requirements
For this tutorial, Visual Studio Code will be used so be sure to have the newest version of it.
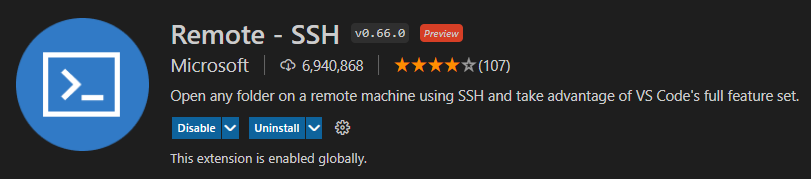
You also need to be in a Linux environment to run the debugger, so if you are debugging on a remote server, we recommand the use of Remote SSH extension to connect your workspace via SSH to the servers (find the list here).
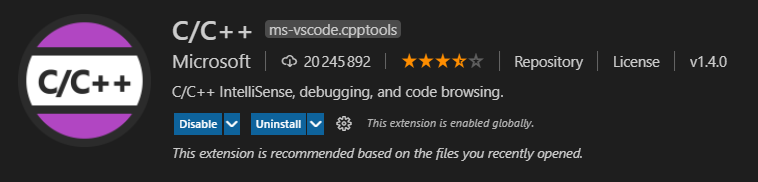
You also need to install the C/C++ extension to install some packages required to debug on VSCode.
You can find those extensions on the Extension section in VSCode.
Before starting to debug
Compile the project
Of course you need to compile your aidge modules before debugging. It is required to debug in a optimization-free environment, so you should compile Aidge with Debug option.
For C++, use DCMAKE_BUILD_TYPE=Debug option.
For Python, you need to set the env variable AIDGE_BUILD_TYPE to Debug:
export AIDGE_BUILD_TYPE=Debug
The launch.json file
To set up the debugger, you need to create a launch.json file in the /.vscode folder.
Then, please copy the entire code given below in launch.json.
{
    "version": "0.2.0",
    "configurations":
    [
        {
            "name": "C++ Aidge Debugger",
            "type": "cppdbg",
            "request": "launch",
            "program": "",                     // Path to binary
            "args": [],                        // Argument to provide (separated by coma)
            "stopAtEntry": false,
            "cwd": "",                         // Path to working directory
            "environment": [],
            "externalConsole": false,
            "MIMode": "gdb",
            "setupCommands": [
                {
                    "description": "Enable pretty-printing for gdb",
                    "text": "-enable-pretty-printing",
                    "ignoreFailures": true
                }
            ]
        }
    ]
}
The only parameters that are important to you are program, args and cwd.
-
program: indicates to the debugger where is the executable of the project (Note : If you want to debug the PythonAPI, you can indicate the path to your python executablevirtualenv/bin/pythoninstead of the aidge binary, this will allow you to debug C++ code called by Python) -
args: indicates the arguments to the command you want to run (Note : If you want to debug the PythonAPI, the first argument should be the path to the script you want to debug) -
cwd: indicates where the debugger has to run the command
Let's debug !
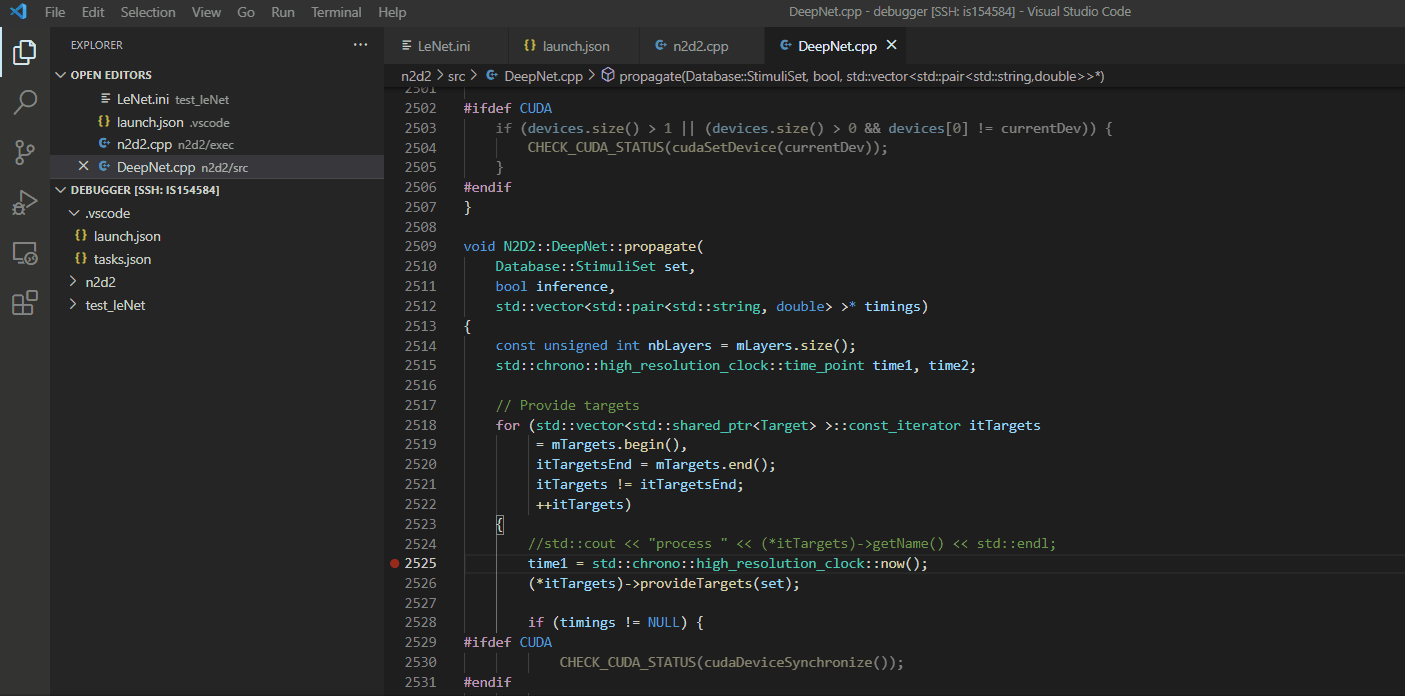
To use the debugger, it is important to define the breakpoints you want to use.
The breakpoints will be necessary to pause the program where you want. Once the program meets a breakpoint, it will provide a view of the local environment.
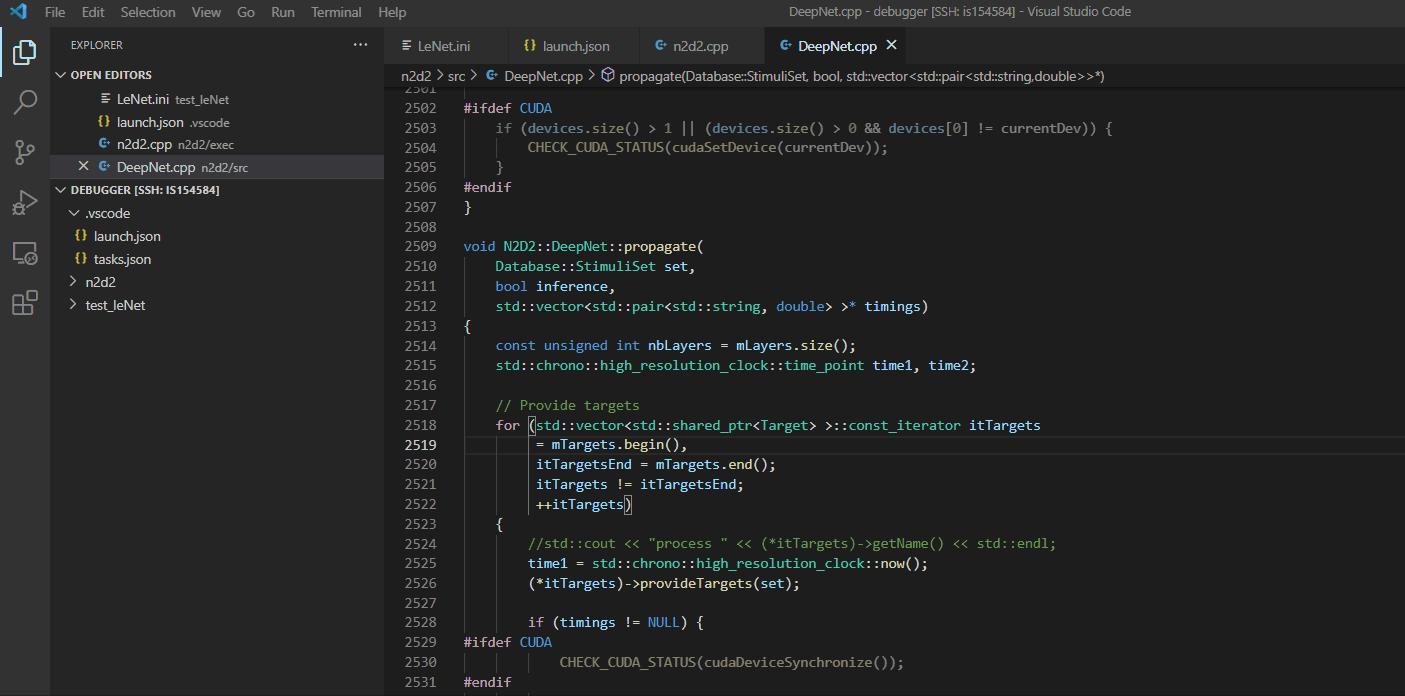
To set up a breakpoint, just click the line where you desire to observe the program behaviour.
Then run the debugger.
When the program meets the breakpoint, you should observe this view.
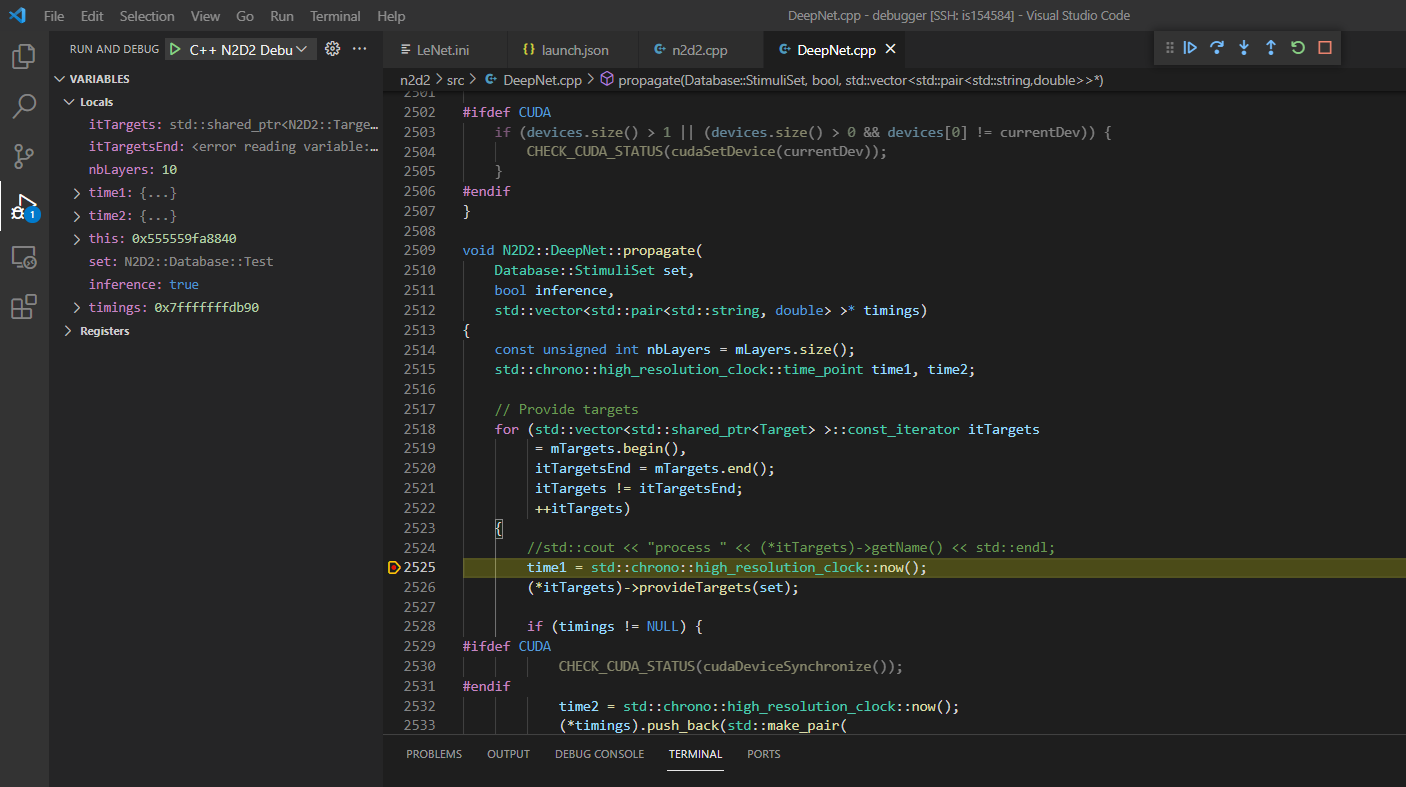
Warning : the debugger only displays variables which belong to the observed file